Dashboards in Crunch are a visual representation of saved analyses, which are shared with anyone who has access to a dataset. Viewers may be granted access to see a dashboard, but not have links to access the underlying dataset.
A dataset can have multiple dashboards attached to it, and dashboards are curated by Editors in Crunch, so each dashboard may look different:
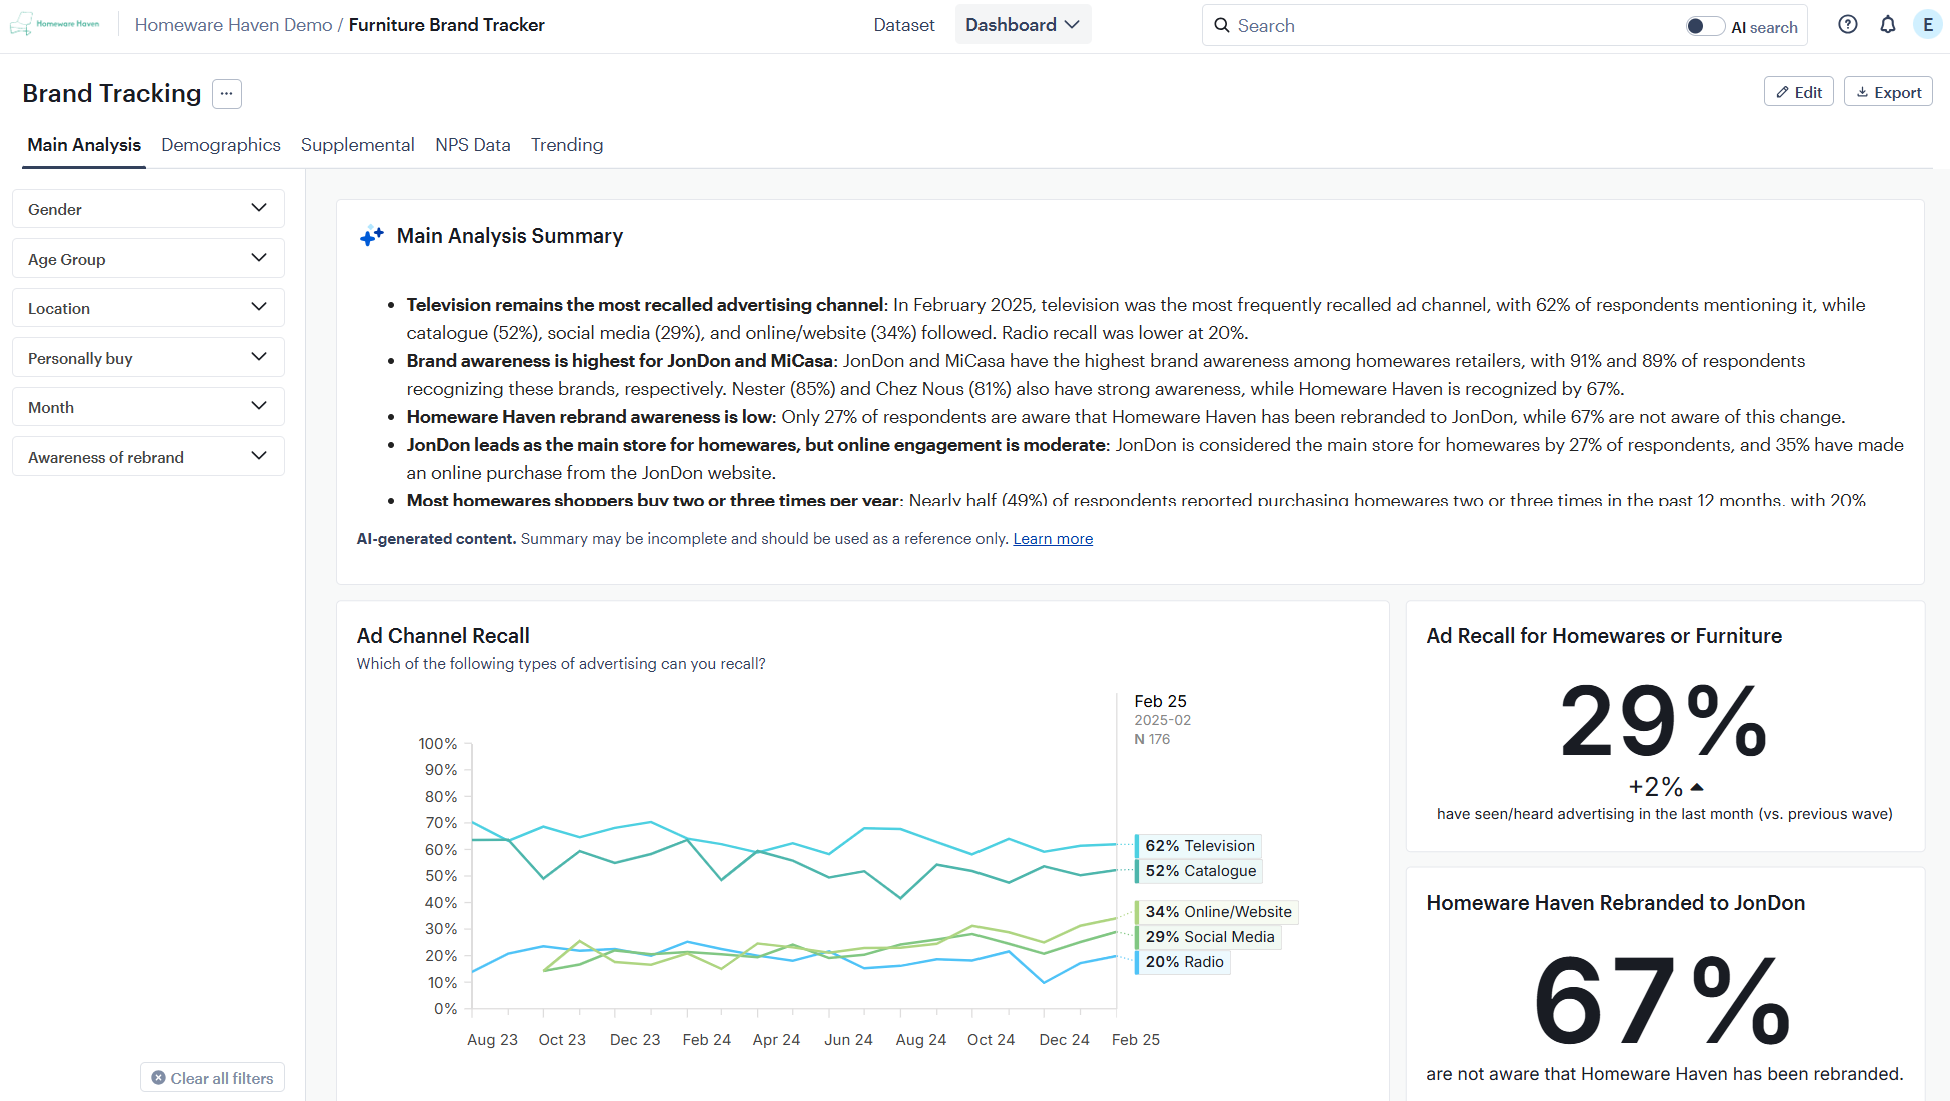
Dashboard Header
Users can change between dashboards, view the underlying dataset, and export the dashboard from the dashboard header:
- If there is more than one dashboard available for the dataset, click Dashboard to see a drop-down list of additional dashboards. Click the dashboard name to switch to another dashboard.
- Click Dataset to navigate to the underlying dataset. This button is hidden for users who do not have access to navigate to the dataset.
- Click Export to export the dashboard contents to PowerPoint or Excel. A panel will open where you can choose the Format and Tabs to include. Click the Export button to generate and download the file on your computer.

Dashboard Filters
Some dashboards are set up with various filters along the left side of the dashboard. If filters have been created for your dashboard, you can click on the categories to expand the available filters:

- Click on the filter(s) you wish to apply to your dashboard.
- Click the X beside the selected filters to remove individual filters
- To remove all of your filters, click Clear all filters at the bottom of the filters.
Dashboard Tabs
Some dashboards are created with multiple tabs. Tabs are displayed across the top of the dashboard, and users can click on the different tabs to see the different content saved in each tab:

Dashboard Tiles
Crunch dashboards are made up of different dashboard tiles, and each tile contains an analysis, image, text, or other curated information. The content, sizing, and placement of dashboard tiles are decided by the user(s) who created your dashboard. Some dashboard tiles are interactive while others are static.
Hover your mouse over a tile to show the three-dot menu, then click the menu to see available menu options:

- Analyze — Allows you to navigate to the underlying data outside of the dashboard. Only users with appropriate permission will see this option.
- Grab this image — Gives you the ability to create a copy of the dashboard tile. You can choose between downloading a PNG file or copying the image to the clipboard on your computer.
- Expand — Opens the selected dashboard tile to full-screen view, which provides a distraction-free view of the dashboard tile contents. Click the Analyze button to navigate to the underlying data outside of the dashboard. Only users with appropriate permission can see this button:
