Using the Display Controller
The Display Controller at the bottom of the analyze interface can be used to determine how the data in a graph or table are displayed.
Which controls are available depends on the analysis being viewed.

Table/Graph – Use this control to toggle between showing a table, horizontal graph, vertical graph or donut chart. The graph type will vary by the types of variables in the analysis.

Count/Percentage, Percent Direction, and Significance testing – Use this control to toggle between counts and percentages. If viewing percentages in a bivariate table or graph, click the arrow control to toggle between percentages summing by column (down), by row (right), or across the whole table. When viewing a table, click the * (asterisk icon) to enable significance testing – this will add shading to the graph indicating if a value is significantly above or below the mean value for that row or column (depending on how the percentages are being summed). When viewing a graph, that * button will turn on confidence intervals.

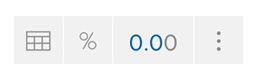
Decimal Places – If viewing an analysis that uses decimal points either for percentages or for numeric means, use this control to determine how many digits are shown after the decimal point.

Swap – Click this control to swap the row variable and the column/group/slice variable.
More options
Click the settings  icon in the display controller. Depending on the analysis being viewed, it may contain the following:

The “Cell details” column contains options for which measures, if any, to display in a tooltip upon hovering over a cell in a table. Not all analyses can show all of these measures, as described below.
Margin of error (e.g., ±3.1%) — This displays the margin of error for the hovered cell, and is available when the currently displayed cell measure is either percentages or population estimates.
The margin of error of a proportion is one-half of a (symmetric) 95% confidence interval around the proportion. An approximate 95% confidence interval for a proportion is:

with:

You can additionally specify the number of decimal places with which to show the margin of error.
Unweighted base — This displays the unweighted base (number of valid rows) for the hovered cell. It is available when the currently displayed cell measure is either column or row percentages.
Weighted base — For weighted datasets, this displays the weighted base for the hovered cell. It is available when the currently displayed cell measure is either column or row percentages.
Count — For weighted datasets, this displays the weighted count (the numerator of percentages) for the hovered cell. For unweighted datasets it shows the unweighted count.
Changing how a Variable is used in a Table
When analyzing a table in Tables and Graphs view you can right-click a variable name to see options for changing the view of that variable (as well as open Variable Properties. At this time, you can only do this when viewing data as a table. Note that any changes made here will not affect the underlying variable, only the currently displayed analysis. If an analysis is saved, these options will be saved with it.
At this time, these changes can only be made when viewing a table. If you want to change how variables are displayed in a graph, use the play controller to display the table, make changes, and then switch back to a graph. The following variable types can have their display changed.
Categorical
Show Means – Use the mean of the selected variable as cell values. Only available if the categorical variable has numeric values (see Variable Properties).
Numeric
Right-click a numeric variable to toggle between:
Show Discrete Values – Each discrete value will be a row/column in the table.
Show Ranges – The numeric variable will be binned into ranges. For example, a range of 2–4 includes all values 2 <= x < 4. At this time, these ranges are determined programmatically; in future releases, we expect to allow you to customize the range sizes.
Show Means – Use the mean of the selected variable as cell values.

Date Time

Hover over Rollup to show a submenu from which you can choose the rollup for the date/time data. Note that if you are an editor you can set the default rollup for a date/time variable in Variable Properties.