Explore is the primary interface for browsing your data in Crunch. It replaces the previous Variable Summaries view with a more intuitive, vertically scrolling experience designed for speed and clarity.

When you open any dataset, you are automatically taken to the Explore tab. This tab displays a summary of every variable in your dataset through individual tiles that provide an instant top-line visualization of the data.
Navigating the dataset
The Explore interface is built for modern, efficient workflows:
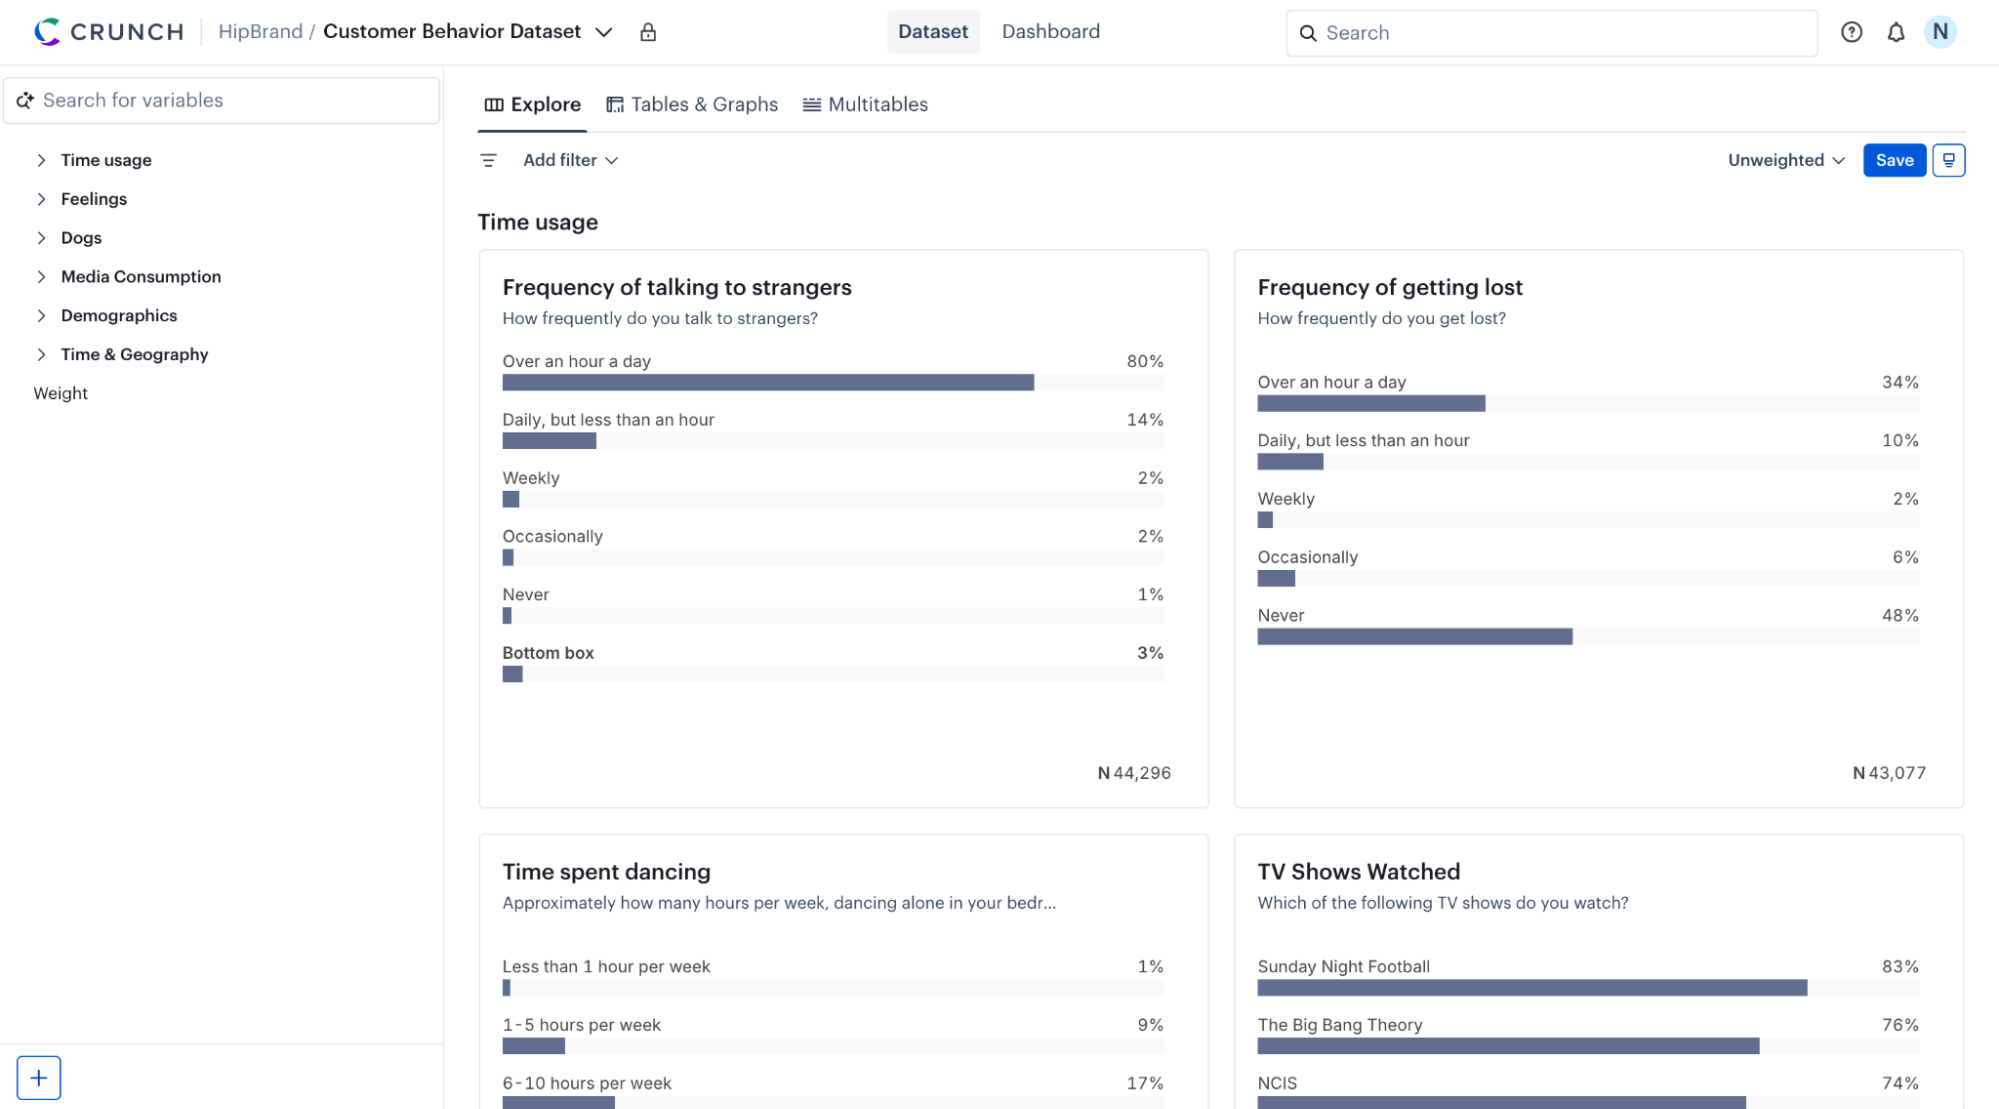
- Vertical scrolling — Rather than clicking through pages, you can scroll vertically to scan all variables in a dataset or folder.
- Folder sidebar — Use the sidebar on the left to navigate between different variable categories or folder sections of your data.
- Folder labels — As you move through different folders, the newly introduced folder labels help you stay oriented and navigate back to higher-level folder sections.
- Tile highlighting — Clicking over or selecting variables from the sidebar highlights them, making it easier to focus your analysis.
Refining your view with filters
The improved filter bar at the top of the Explore tab allows you to focus your analysis on specific audiences:
- Add filter — Click the filter icon to open the dropdown menu.
- Select conditions — Choose from existing filters or create new ones to instantly update all variable summaries in the Explore view.
- Clearance and clarity — The interface ensures that you always know which filters are currently applied to your data.
Using the Display Controller
Use the Display Controller at the bottom of the screen to change display settings:
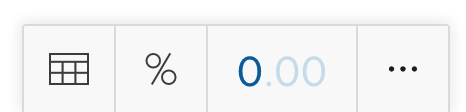
If you don’t see the display controller, move the pointer towards the bottom of the screen to reveal it.
Discovery and insights
The combination of clearer folder labels, variable navigation, and vertical scrolling allows users to gain a better understanding of a dataset. This unified experience modernizes the Crunch workflow, making it more intuitive to discover meaningful insights quickly.