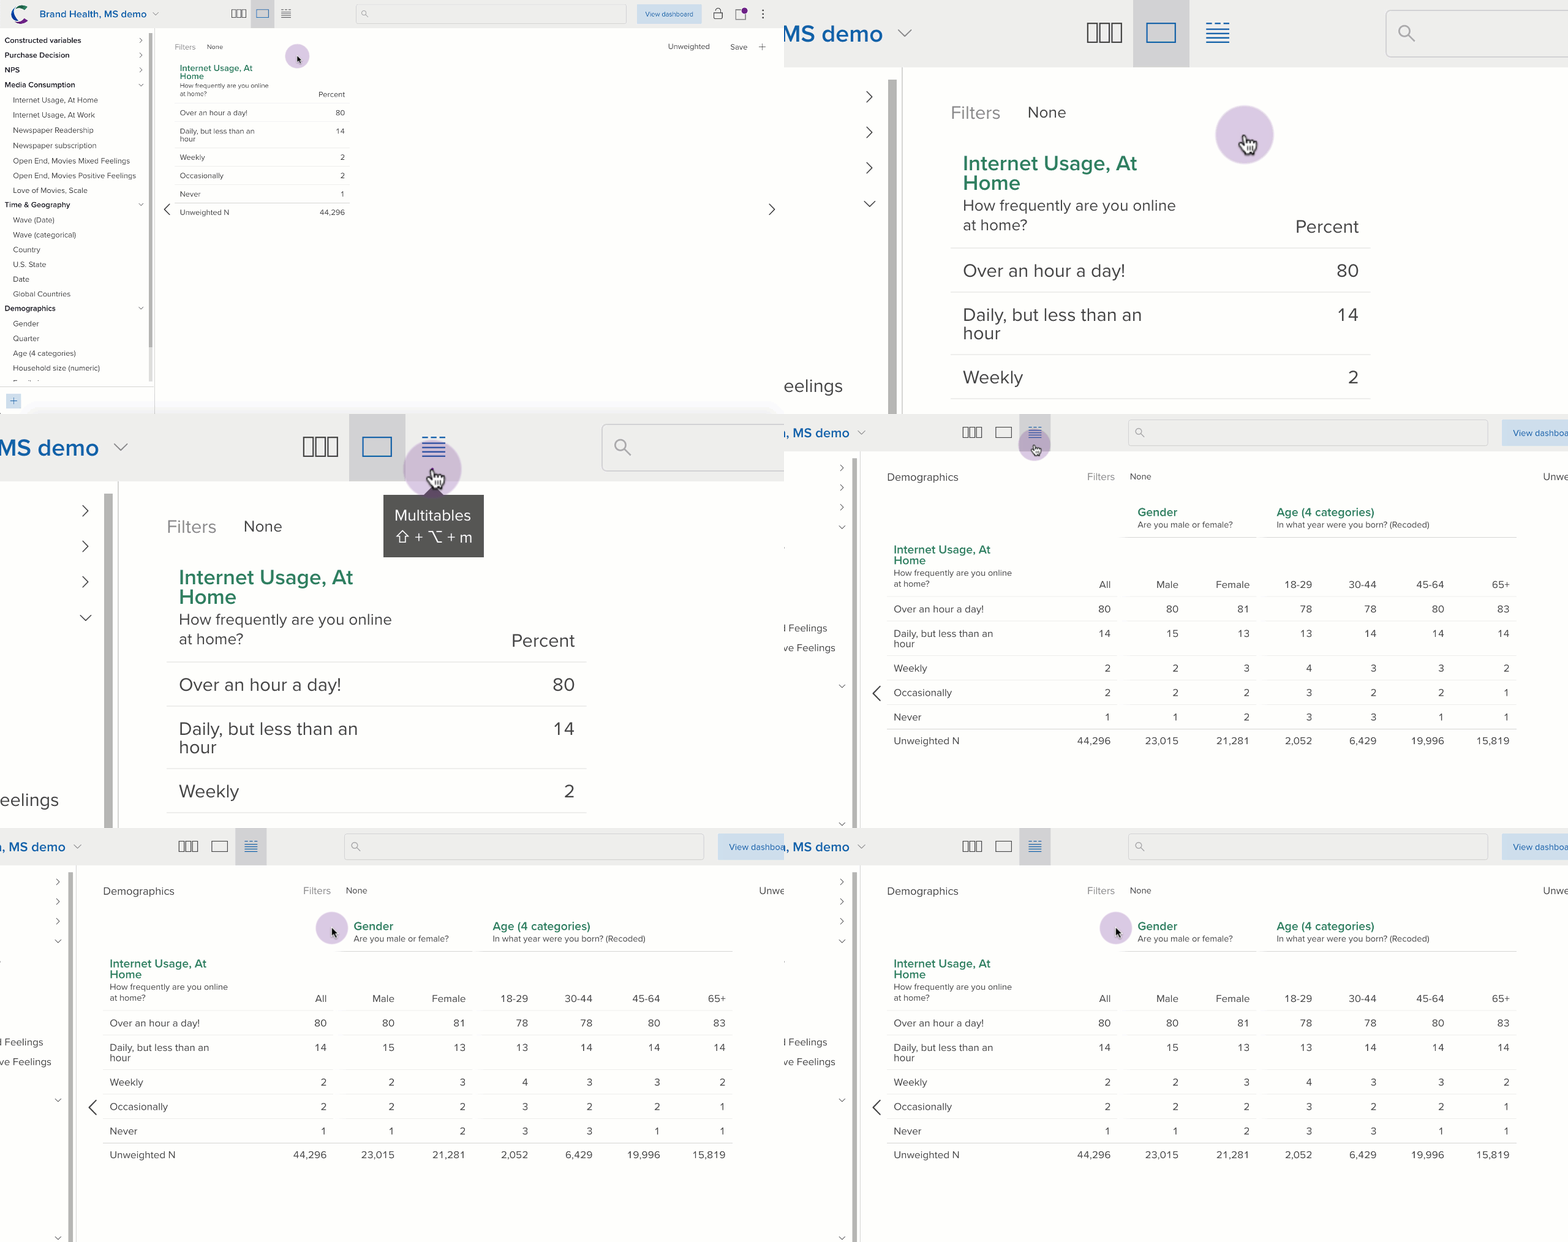
It is commonplace in traditional research to look at questions side-by-side in the columns. These are often referred to as tabs, banners, or cross breaks.
In Crunch this concept is multitables.
It is the third view in Crunch - the third icon in the grey bar.

Note: The reason banner tabs exist in traditional research is that DP departments wanted to transmit all possible cuts of the data efficiently, to avoid further tab requests. However, the interactive environment in Crunch means you don't need to have every possible cut, since you have all the data at your fingers. Nonetheless, multitables are provided for those who want to look at multiple variables in columns and produce tab books in Excel (including customizing the statistic(s) shown and indicators of significance, such as ABCD letters).
In this article, we show you how to work with multitables in the web app, including making one and editing an existing one. In the next section of this course, we step you through how to export tab books to Excel.
Working with multitable view
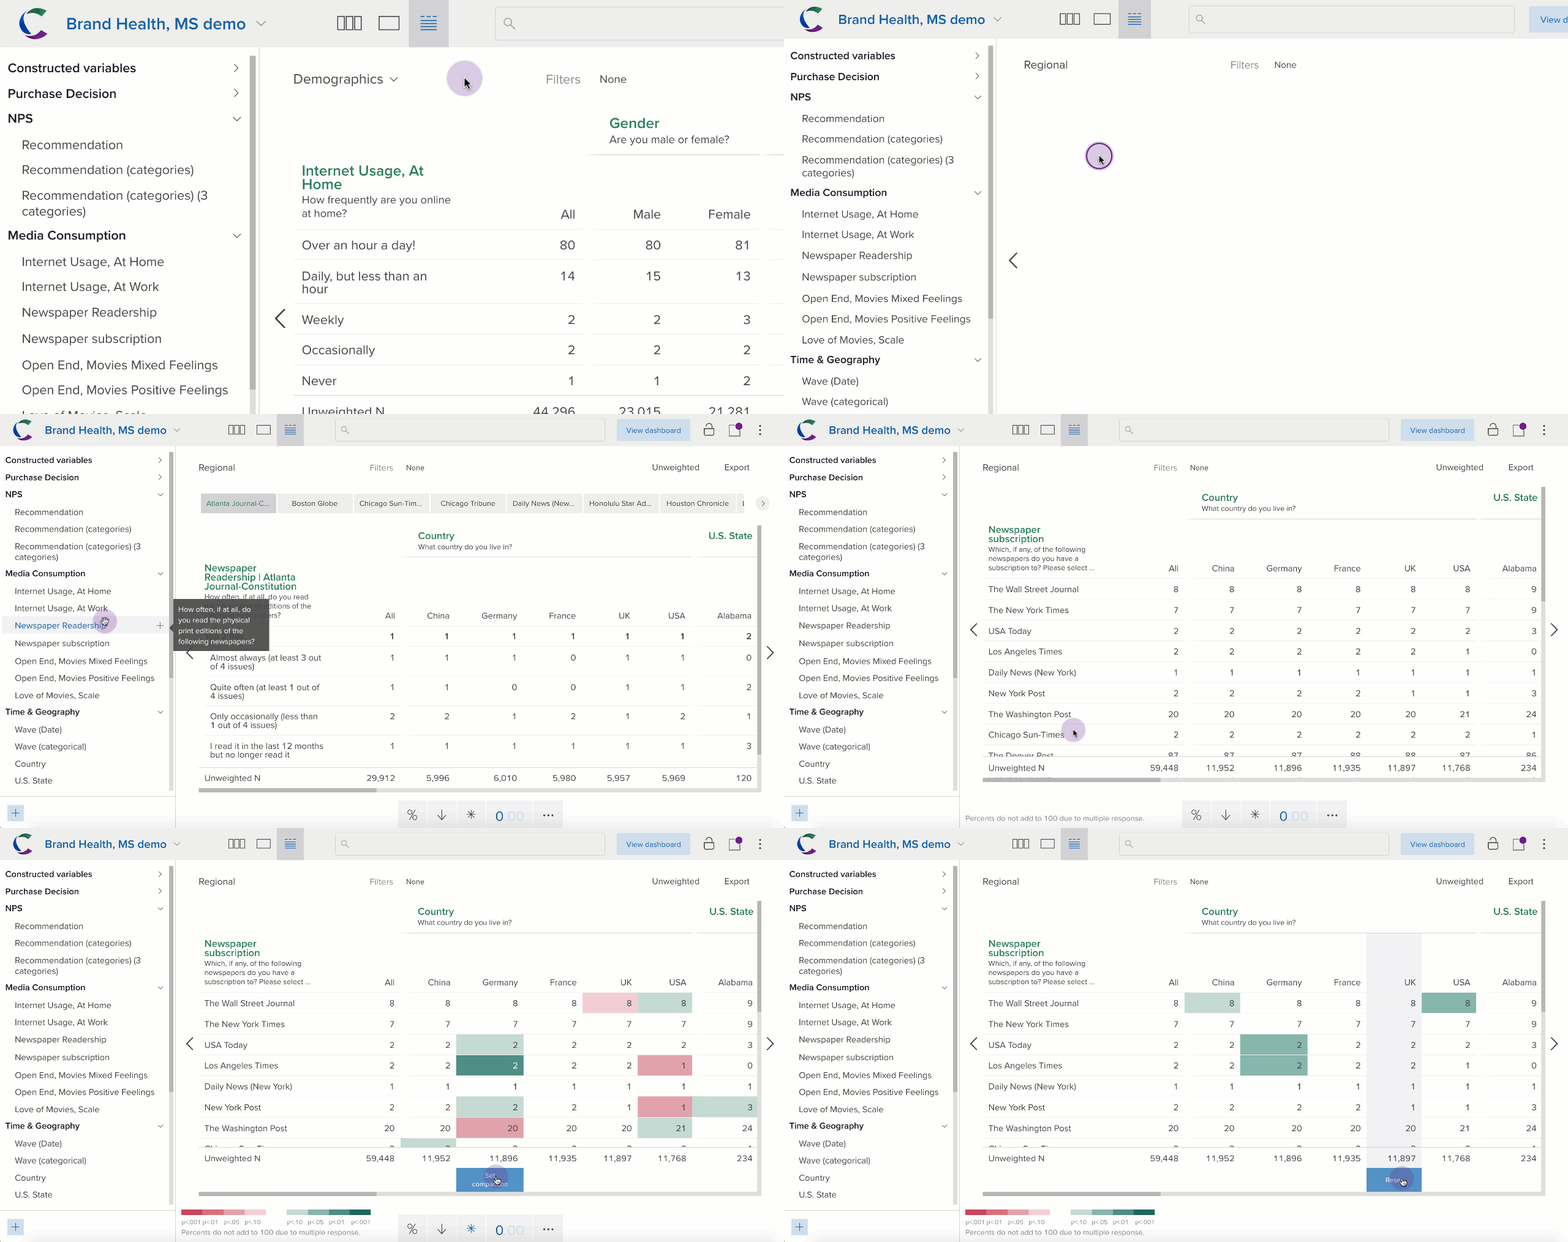
You can switch between the multitables, by using the drop-down menu in the top right. We discuss in the next section how you can set up a multitable if you don't have any set up.

You can change:
- the question in the rows simply by clicking or dragging it from the Variable Sidebar on the left
- filters and weights in the usual way (with drop-zones and the drop-down menus)
- statistics and the hypothesis testing using the Display Controller at the bottom
Note: You cannot make a multitable into a graph and you cannot swap the rows/columns (the multitable can only be used along the top, not as rows).
You can achieve custom statistics and significance shading using exports with tab books.
Setting up a multitable
You may have multitables already set up by dataset Editors (ie: DP). Or you can make your own. You need to have a multitable set up before you can make tab books (in Excel).
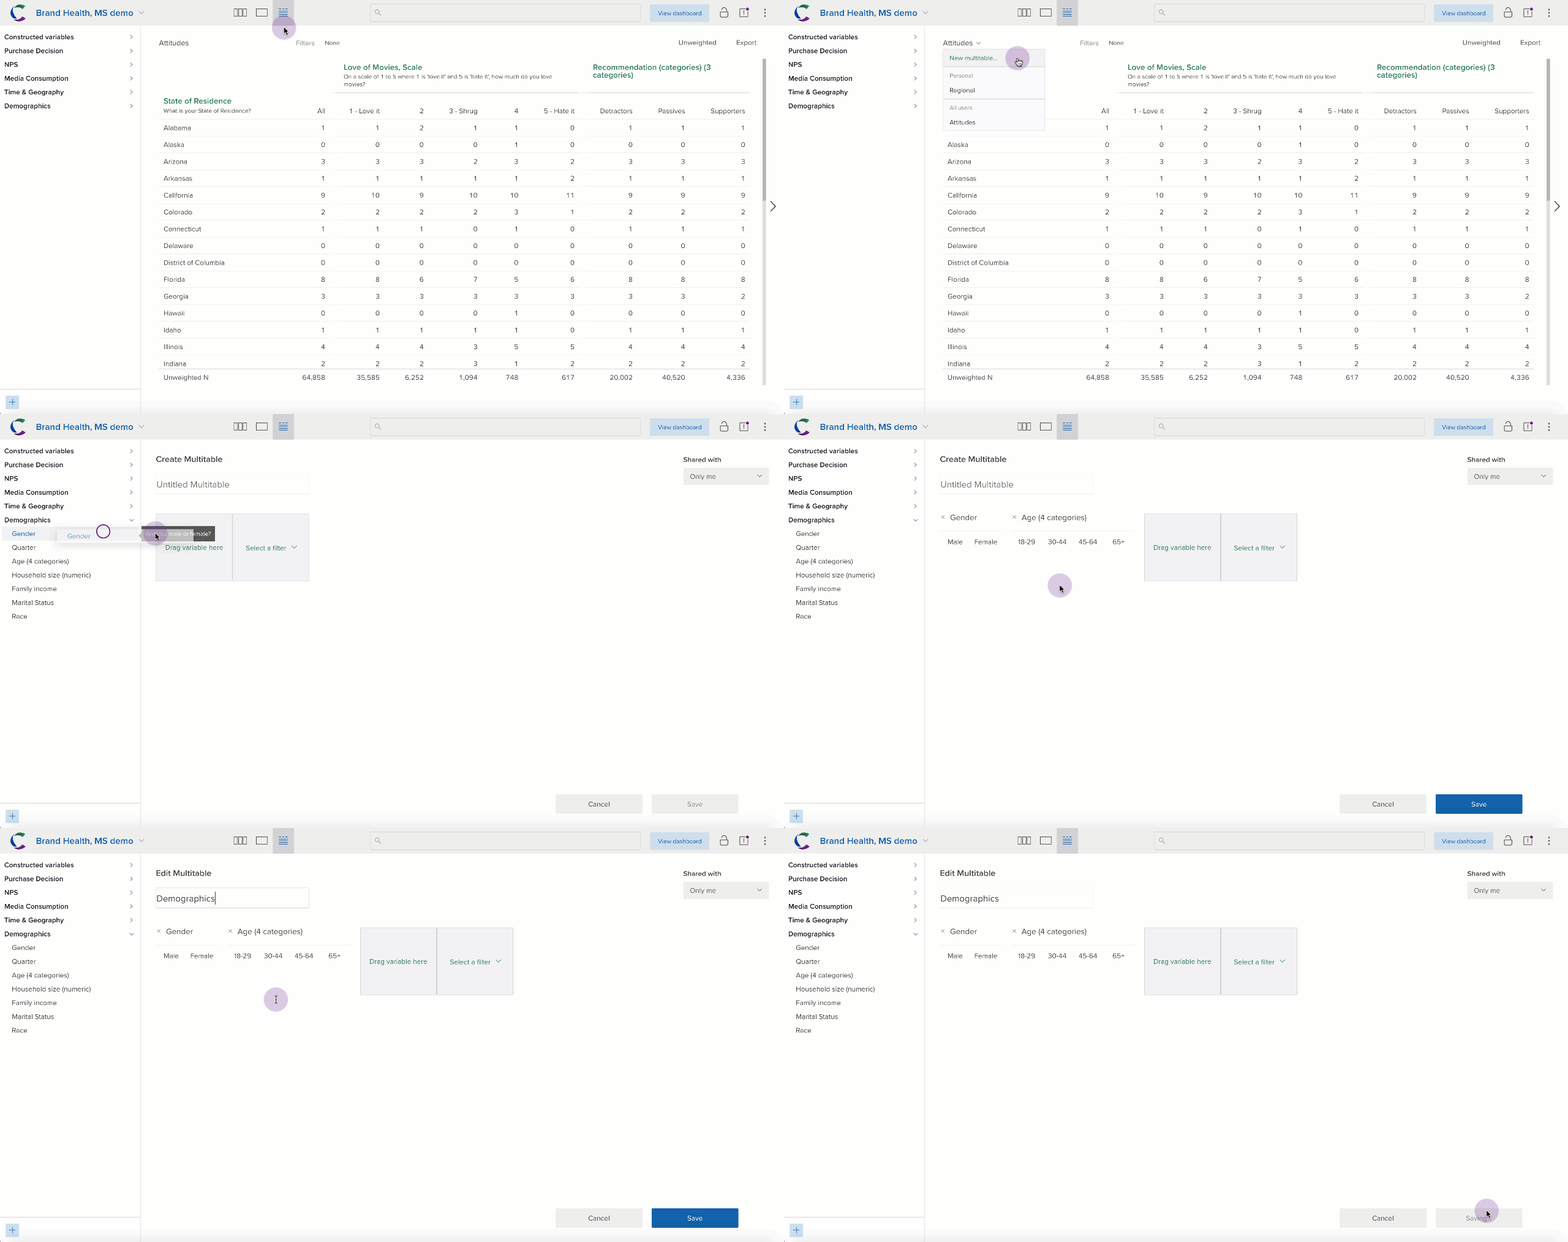
If there are no existing multitables stored in the dataset, Crunch will then open the multitable creation area automatically. Otherwise, to create a multitable, click drop-down in the top left and select New multitable.

To add columns to the multitable, you simply select variables from the Variable Sidebar (as many as you like).
You can edit an existing multitable you've made, simply by selecting Edit from the drop-down.
Frequently asked questions
How do you merge categories in a banner?
You can use the Combine Categories feature to make a new variable with the combine categories, and then add that into your mutlitable. For example, if you have lots of brackets for age, and you want to collapse them into broader buckets. Or perhaps you have data for all 50 states of the USA, and you want to combine them into broader regions for your multitable.
The other way is to have subtotals (nets) set up in the original variable. These will then appear in the multitable that use that variable.
How do you 'nest' variables in a banner (eg: Age x Gender)?
You first build an interaction and then put that into your banner (eg: you have 4 Age categories and 2 gender categories and you want the 8 Age x Gender categories)
Can I hide a column in the banner?
If you want to hide a particular column, you select it when you are either making or editing a banner and it greys out to indicate that it will be hidden.
You can also add filters to the multitable by using the Add Filter dropzone in the multitable creation/editing area. You can use an existing saved filter, or build a custom filter. Adding individual columns like this will have no significance shading or testing.
If you are building lots of these columns and/or you are interested in the significance testing, you should consider asking your Editor (DP department) to build a custom multiple response variable and insert that into the multitable (as part of the dataset specs).
See also